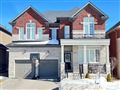
23 Valleyview Dr
$821,237
Comparative Market Analysis
Jun 15, 2025
NOT AN ACTIVE LISTING
Historical Performance
| Period | $ Change | % Change |
| 1 Day | +$55 | +0.007% |
| 7 Days | -$357 | -0.044% |
| 30 Days | -$2,212 | -0.269% |
| 3 Months | -$1,939 | -0.236% |
| 6 Months | +$17.1k | +2.13% |
| 1 Year | -$33.9k | -3.96% |
| 3 Years | +$158k | +23.8% |
| 5 Years | +$261k | +46.5% |
| 10 Years | +$506k | +160% |
List My Property
Real Estate Statistics
Financing Solutions
AS SEEN ON


Are You a Licensed Real Estate Agent or Broker?